Challanges
The MedTech business faced significant hurdles in monitoring and comparing its pricing performance with competitors. There was limited visibility into Average Selling Price (ASP) and market pricing trends across platforms and regions. Competitor data was fragmented and difficult to access, making it challenging for business stakeholders to align their pricing strategies with market realities.
Without an integrated system, teams were spending significant time gathering data manually from disparate vendors and validating it, which delayed decision-making. The lack of real-time, reliable insights also reduced the ability to react quickly to market changes or competitive moves.
Scope of Project
The project focused on creating a comprehensive pricing scorecard dashboard that would consolidate data from multiple vendor sources and provide a customer-centric view of the MedTech market. The goal was to:
- Deliver competitive ASP and market pricing comparisons at both the platform and overall business level.
- Enable leadership and sales teams to analyze performance against competitors on a yearly basis.
- Provide intuitive and interactive visualizations to support faster, data-driven decision-making.
- Establish a scalable and reliable architecture for continuous market insights.
Solution Provided
To address these challenges, a Competitive Pricing Scorecard Dashboard was developed using Tableau, supported by a robust backend data architecture.
- Data Integration and Preparation
- Collected and consolidated pricing and market data from multiple external vendors such as DRG and ECRI.
- Data was ingested into Amazon Redshift where it was standardized, cleaned, and validated.
- Additional validation and cross-checks were performed using SQL queries and Excel-based rules to ensure accuracy.
- Visualization and Analytics
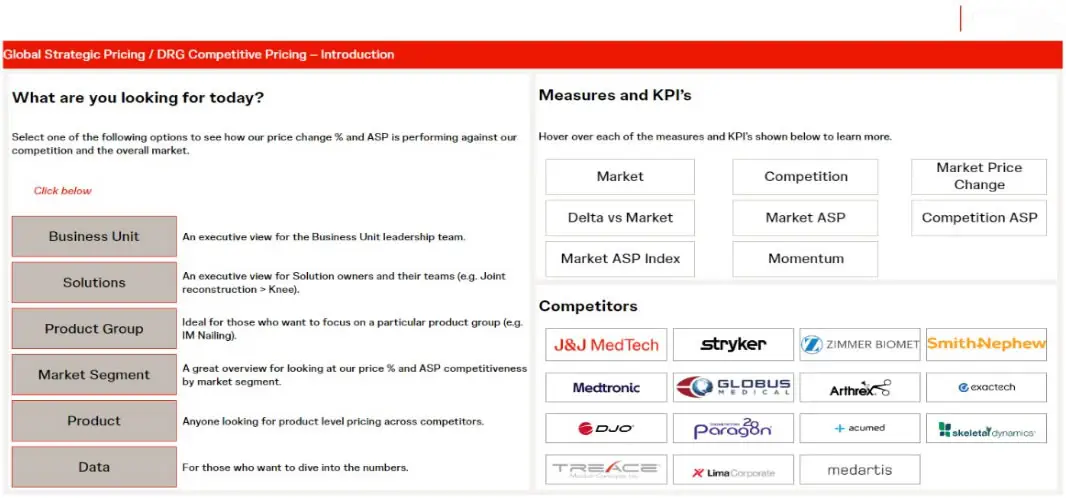
- A Tableau dashboard was designed to display key pricing metrics including:
- Market Price (sales/volume by country, product hierarchy, and year).
- Construct ASP and ASP momentum.
- Competitive comparisons for ASP vs competition, both current and year-over-year.
- Dashboards were made interactive, allowing users to filter by country, region, platform, and competitor to quickly analyze specific market segments.
- A Tableau dashboard was designed to display key pricing metrics including:
- Business Usability and Insights
- Provided a customer-centric market view, allowing pricing and sales teams to align strategies with competitive benchmarks.
- Incorporated ASP momentum tracking to evaluate changes against prior years and adjust pricing tactics.
- Enabled stakeholders to access dashboards through Tableau Server, ensuring real-time accessibility and collaboration across global teams.
- Scalability and Future Readiness
- The architecture was designed for easy expansion to include new vendors, additional geographies, and updated KPIs.
- Automated refreshes ensured that the dashboards always reflected the most current market data.
Business Impact
- Faster and Better Pricing Decisions: Decision-makers gained the ability to compare ASPs across competitors instantly, rather than relying on delayed manual reports.
- Improved Market Responsiveness:Real-time dashboards allowed pricing teams to react quickly to competitor moves and adjust strategies to maintain market competitiveness.
- Operational Efficiency: Reduced manual data collection and validation efforts, freeing up resources for deeper strategic analysis.
- Customer-Centric Insights: Sales and franchise teams could now align more closely with customer expectations and market dynamics, strengthening competitive positioning.
- Strategic Alignment: Leadership gained a consolidated view of global pricing performance, improving planning and forecasting accuracy.
Technical Architecture
- Data Storage & Processing: Amazon Redshift
- Data Validation: SQL, Excel
- Visualization & Reporting: Tableau (Scorecard dashboards, competitor ASP analysis, momentum tracking)
- Data Sources: Vendor-provided datasets (DRG, ECRI, and other MedTech market data)
- Deployment: Tableau Server for global accessibility and collaboration